
Analytics and drop-off
Analytics shows charts of your responses. Drop-off shows where visitors stop filling in your form. Both are tabs on the form's dashboard. Drop-off is part of the Pro plan.
Analytics tab
- Open the form's dashboard from the Forms page.
- Click the Analytics tab.
- Under Responses over time, pick 7 days, 30 days, 90 days or All.
- Scroll to Responses by question to see a chart for each question.
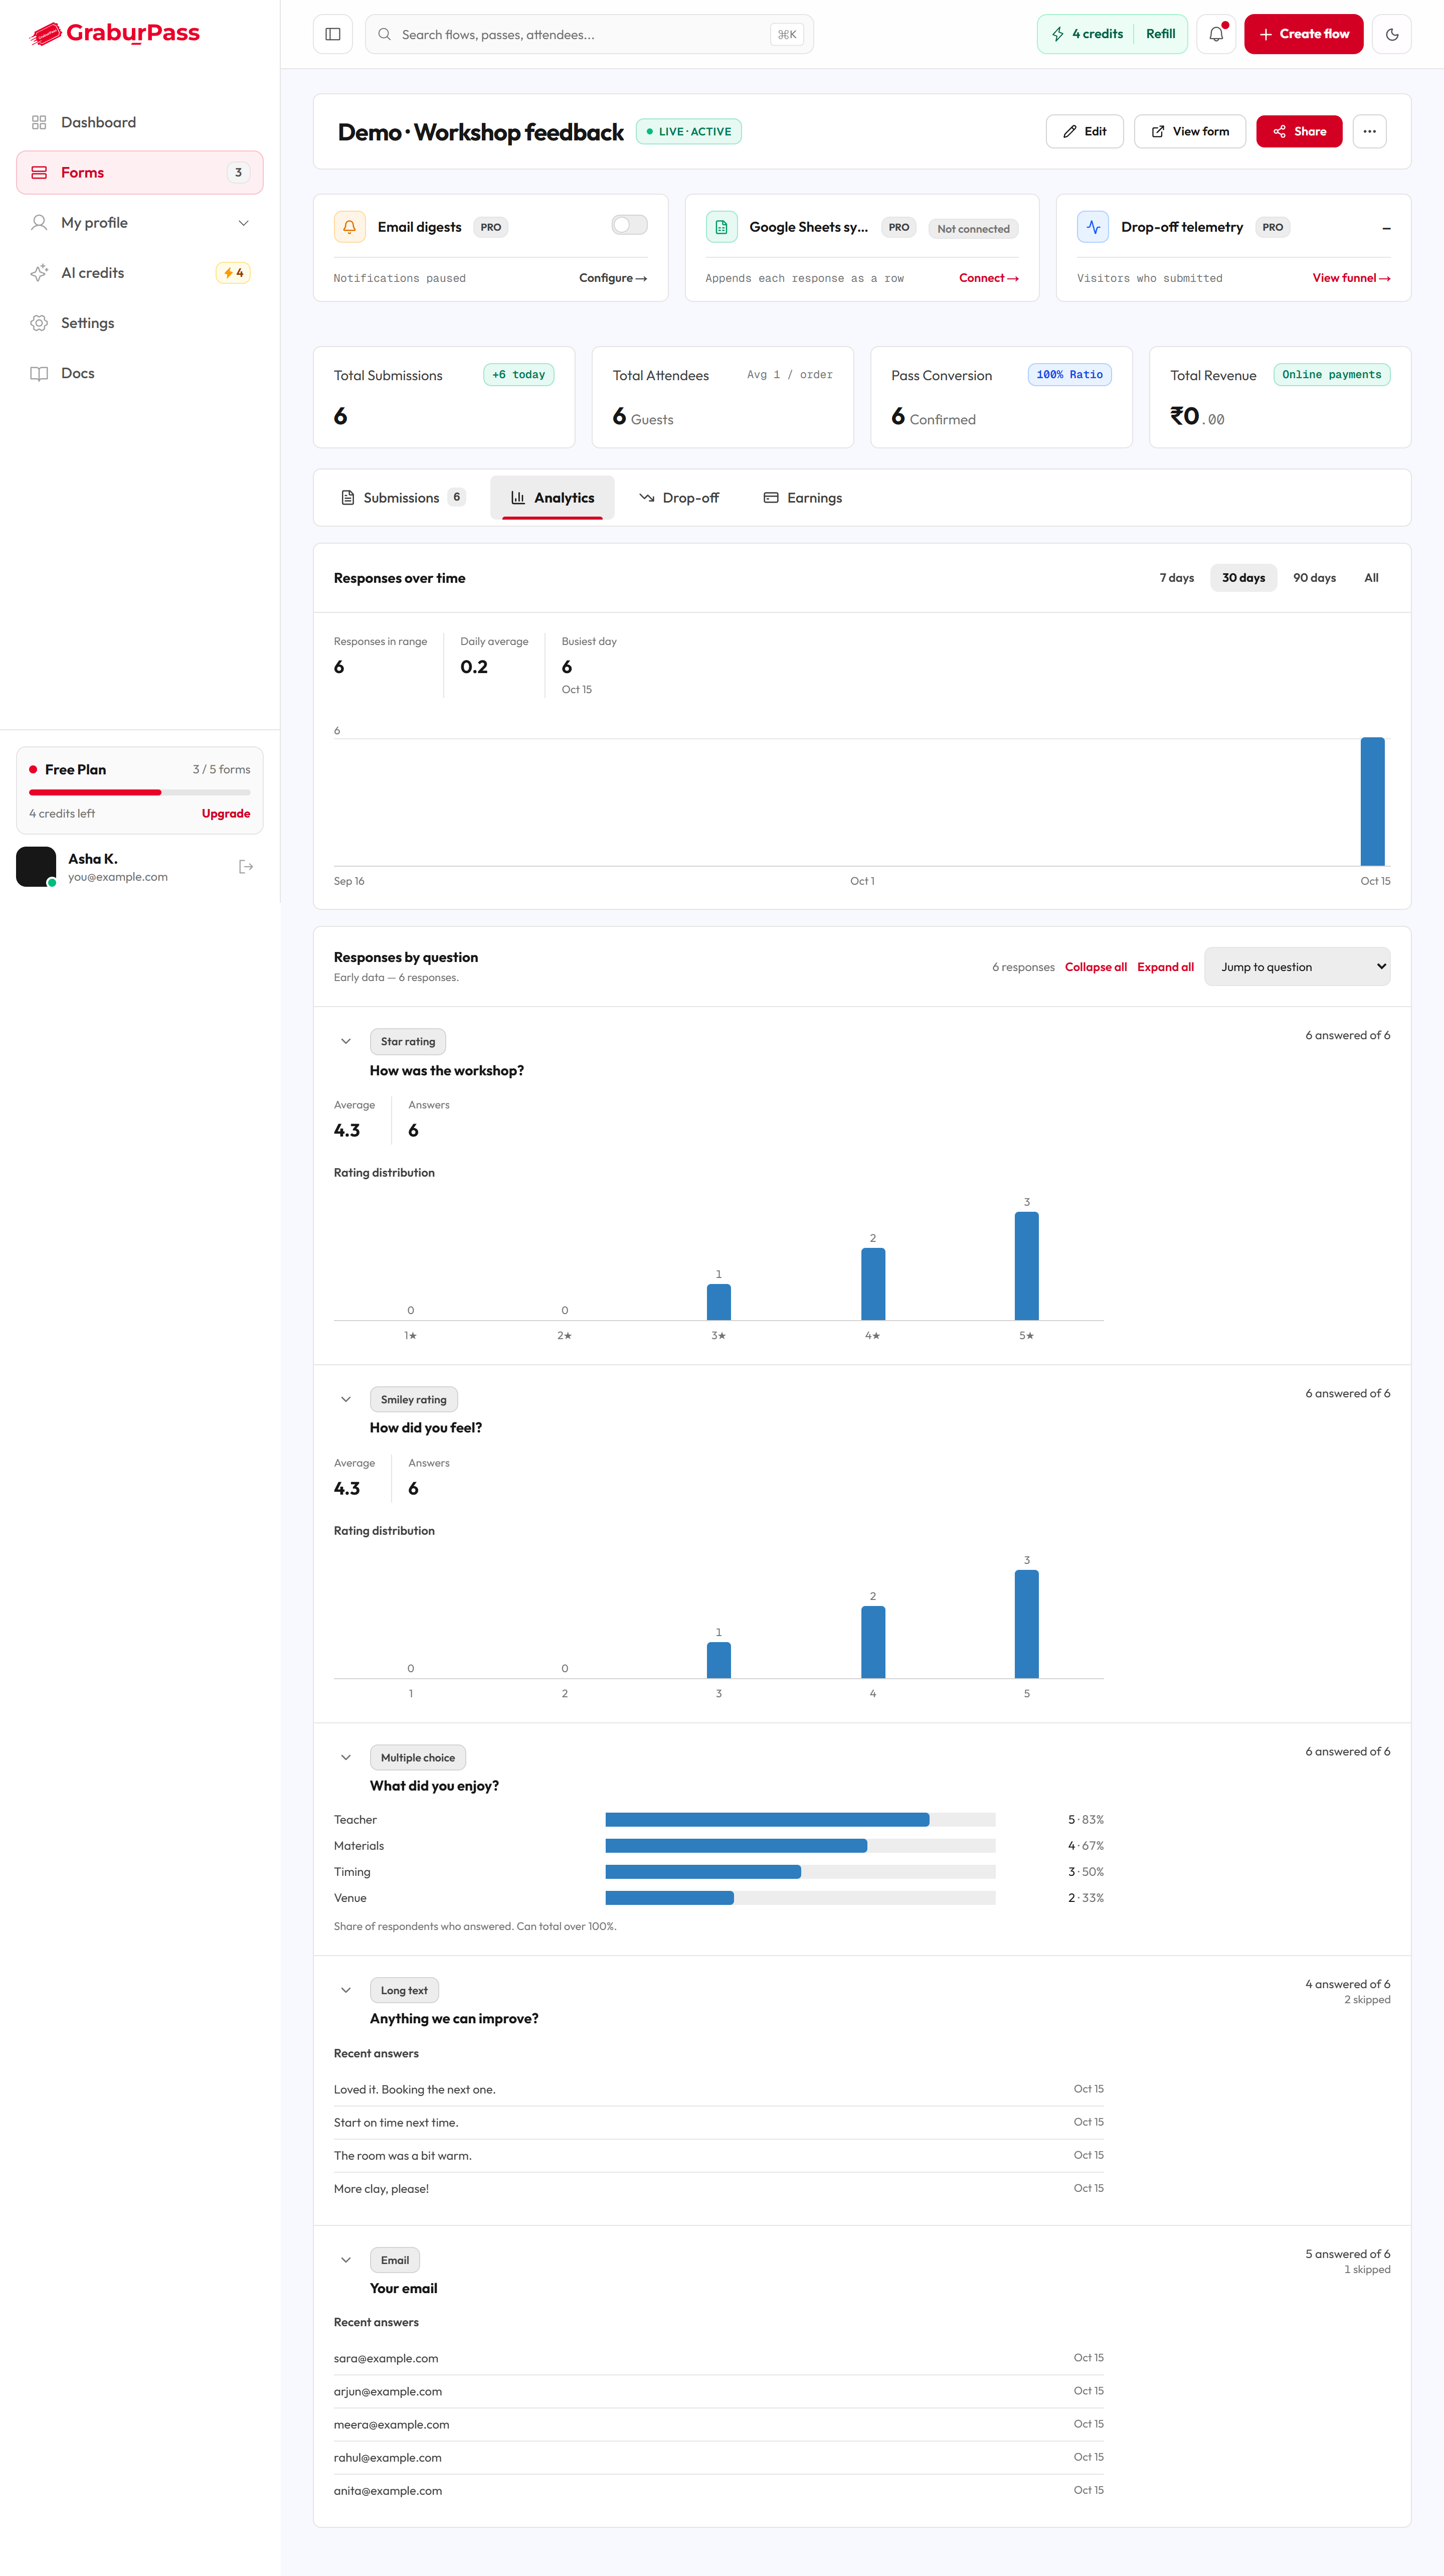
Tiles
| Tile | What it shows |
|---|---|
| Responses in range | How many responses came in during the range you picked. |
| Daily average | Responses per day in that range. |
| Busiest day | The day with the most responses. |
Per-question charts
Each question gets a card with a label for its type, such as Single choice, Star rating or Short text.
| Control | What it does |
|---|---|
| Filter questions | Type to find a question by name. |
| Jump to question | Scrolls to the question you pick. |
| Collapse all / Expand all | Closes or opens every card. |
| Show all N | Cards for written answers show the five newest. Click this to see the rest, and Load more for long lists. |
If you deleted a question after people answered it, it shows under Removed questions. Its old answers are still there.
| Message | What it means |
|---|---|
| No responses yet | Charts appear once someone submits the form. |
| No responses in this period. | Try a longer range. |
| Based on the responses visible on your plan. | Some responses are locked by your plan, so the charts leave them out. |
Drop-off tab
Use this to find the question that makes people leave. Open the Drop-off tab. On the Free and Builder plans you see a preview and a prompt to upgrade to Pro. See Plans and AI credits.
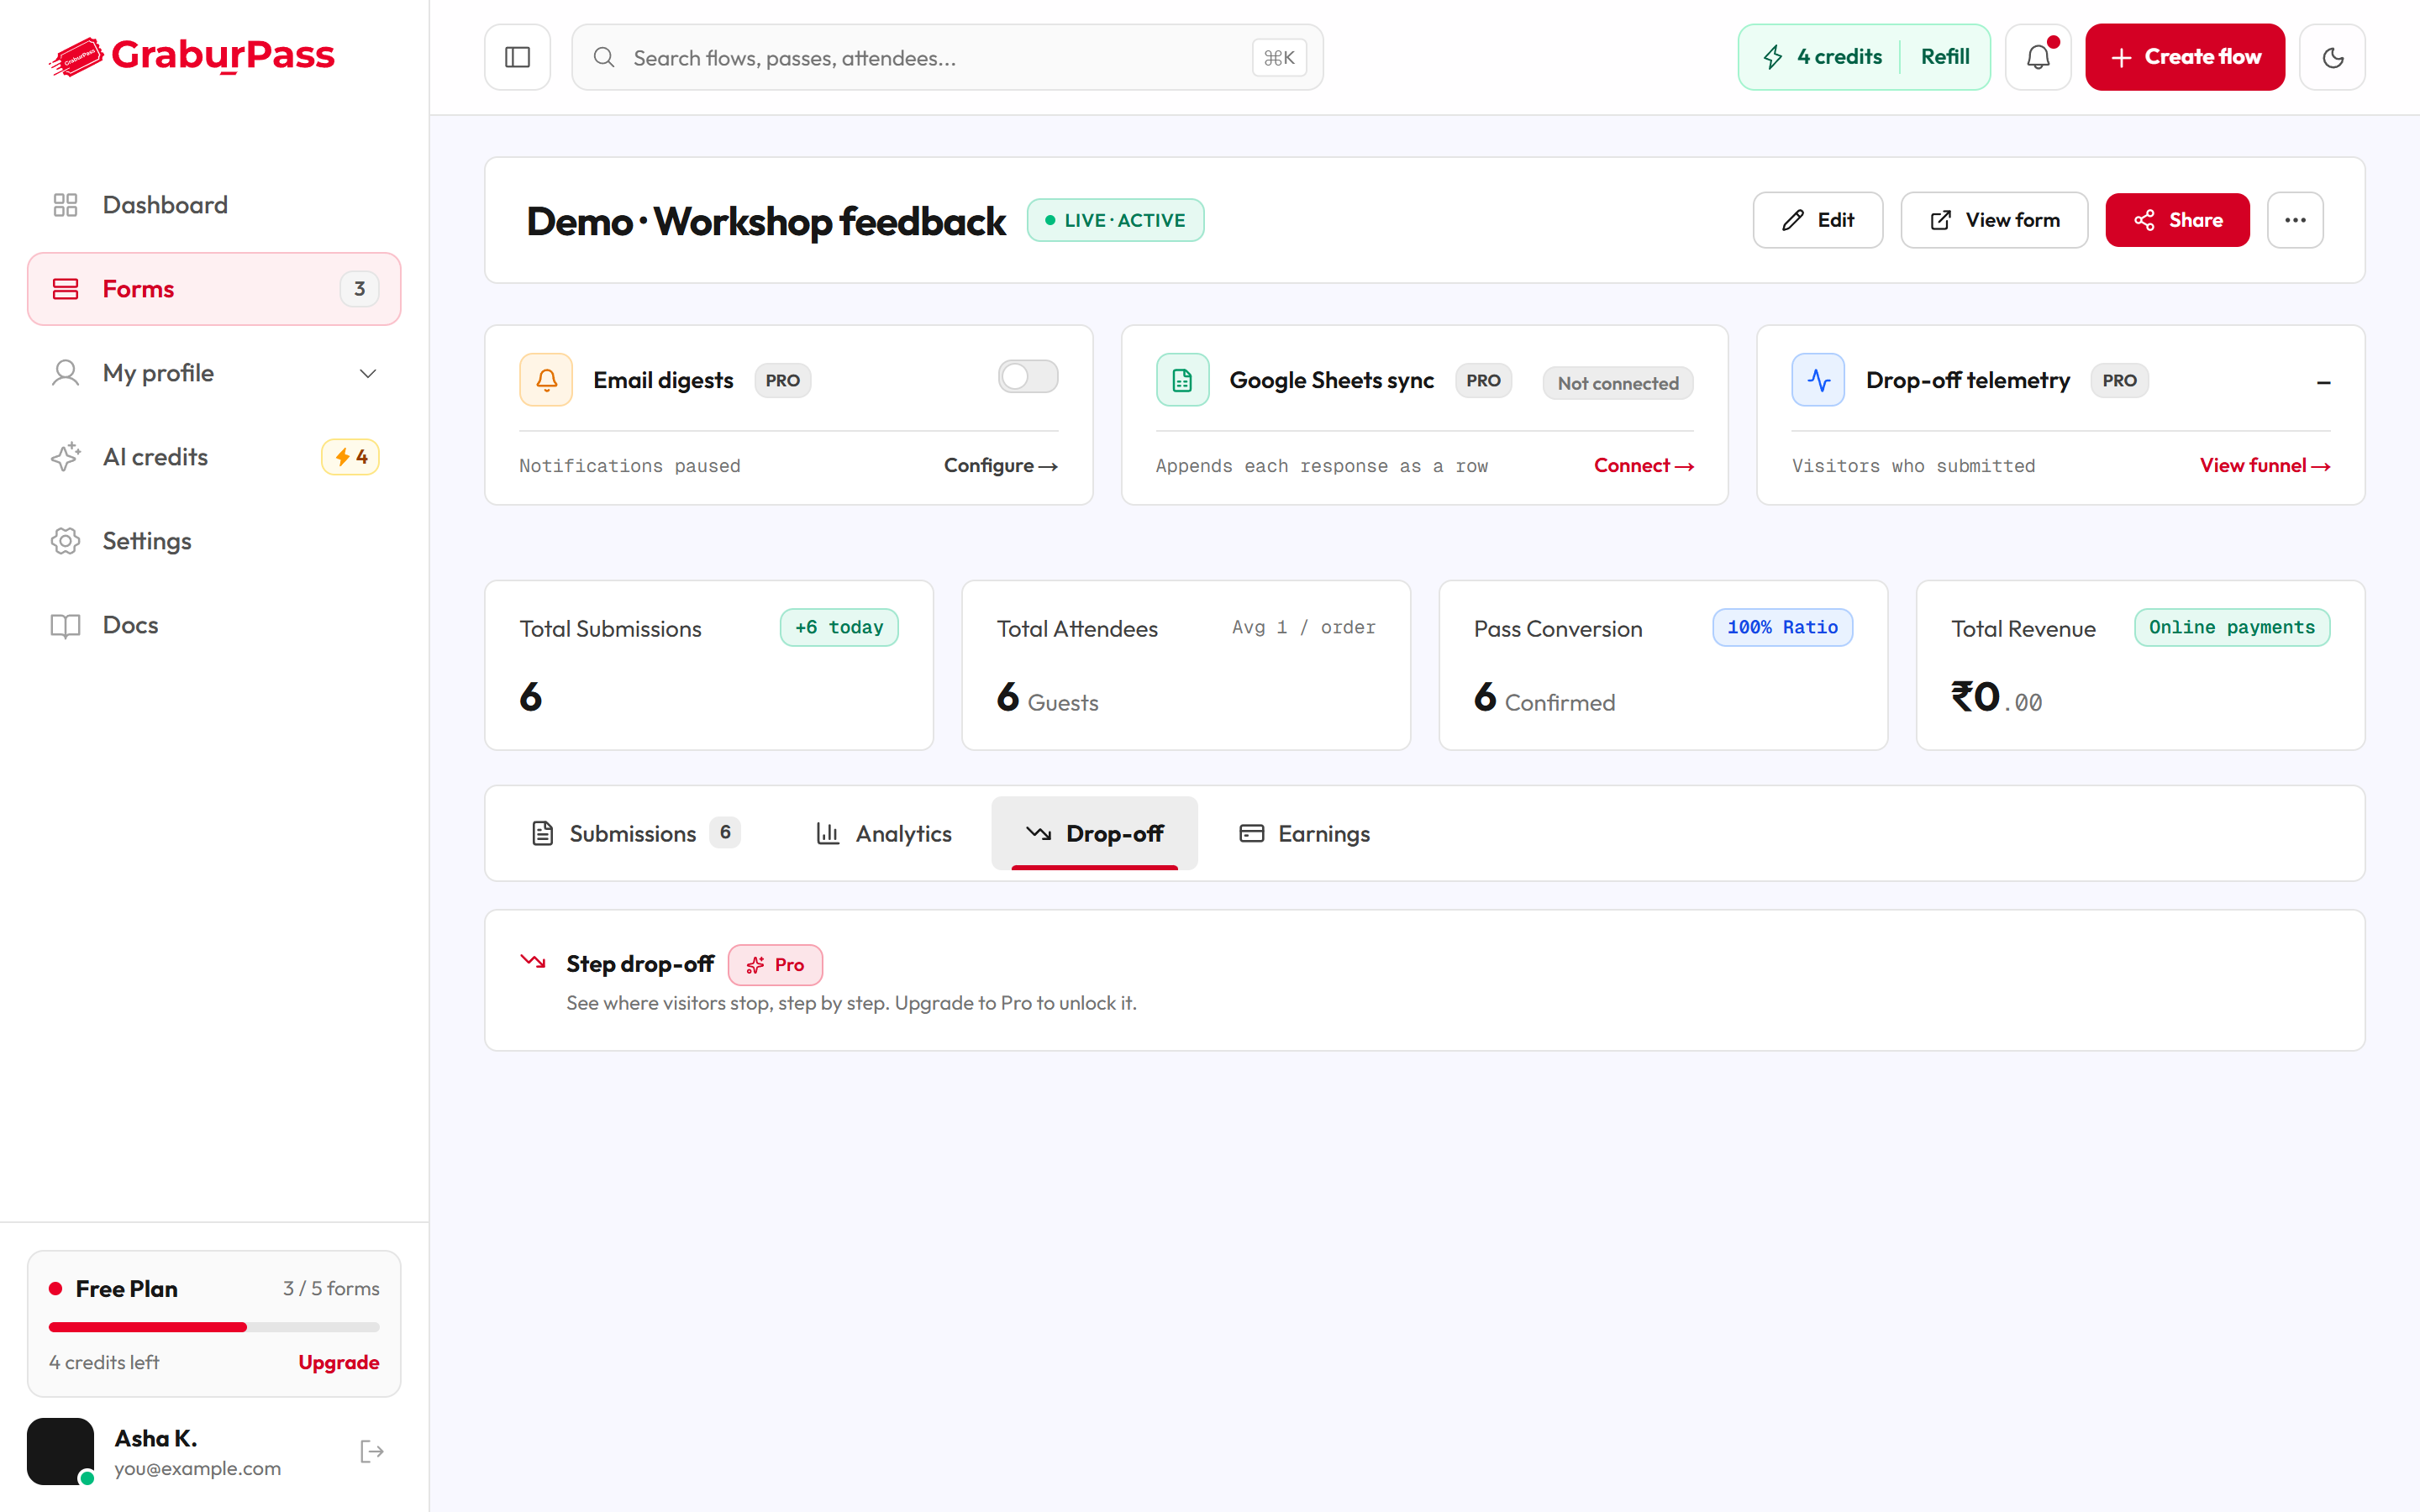
The tab is titled Step drop-off. At the top you see the share of visitors who submitted. Below, each step has a row showing how many visitors reached it. The step that lost the most people is flagged Biggest drop-off. The last row, Submitted, counts people who finished.
How a step counts
A step counts the first time a visitor clicks into it, taps it or answers it. Someone who scrolls past without touching a question does not count for that question.
| Message | What it means | What to do |
|---|---|---|
| Early data — based on N visitors. | Too few visitors so far to trust the numbers. | Wait for more visitors. |
| Not enough traffic yet | It fills in once visitors start filling in the form. | Share your form. |
| Couldn't load drop-off data. | The data didn't load. | Click Retry. |